Bitcoin Price Prediction This Week: The Monday High Short
A recurring pattern on bitcoin's weekly chart: the high of the week keeps forming early, often on Monday, and fading from there. Here's what the setup looks like across recent weekly ranges, and what it would take to catch it.
BY DEREK CHU5 MIN READ
The setup
Across the weekly ranges shown on the chart, Monday has been a weak day for bitcoin. In every one of these ranges, the week's high formed on Monday, and shorting that level would have worked each time.
The high itself hasn't formed at a consistent hour — the wick has printed during the Asia, London, and New York sessions in different weeks. But once it forms and price confirms a break of local structure, the setup has caught a drop of at least 2.5% every time in this sample.
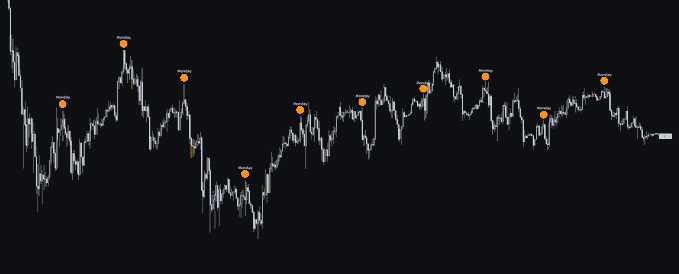
Weekly BTC chart with Monday highs marked (red) and the pullback range that followed (shaded).
Reading the pattern
The marked chart shows a string of recent weeks where the high of the week lands on or near Monday before price fades into the rest of the week. The wick itself doesn't form at a fixed hour — it has shown up during the Asia session, the London session, or the New York session depending on the week — which is why the setup calls for structural confirmation (a break of local structure after the wick) rather than shorting the level blind the moment it prints.
That structural confirmation step matters: a wick alone isn't a signal, it's a candidate. Waiting for price to actually break down through nearby support after the Monday high forms is what separates catching the move from getting caught in a continuation higher.
The caveat
This is a pattern read off a small, recent sample of weekly ranges, not a statistically validated edge or a guarantee the sequence continues. Weekly seasonality patterns like this one tend to get arbitraged away once enough traders lean on the same level, and a single strong trending week can break the pattern outright. Treat it as one input for building a thesis, not a signal to trade mechanically — especially against a backdrop where views on bitcoin's own risk profile are already sharply divided.
WHY IT MATTERS
Intraweek seasonality patterns circulate widely on trading social media, and this one is being read purely off price action, with no fundamental catalyst attached. It's worth understanding how the setup is built and where it could fail before treating it as anything more than a chart observation.
What to watch next
1.Whether this Monday's high holds up as the weekly high once the structural confirmation criteria are checked.
2.Which session — Asia, London, or New York — prints the wick this time around.
3.Whether the pattern breaks once it gets enough attention, as crowded seasonality trades often do.
Frequently asked questions
What is the Monday high short pattern in bitcoin?
It's a recurring chart pattern where bitcoin sets its weekly high early in the week, often on Monday, then reverses. Traders who shorted that Monday high have historically caught a 2.5%+ drop in most recent weekly ranges.
Which trading session forms the Monday high wick?
The wick has typically formed during the Asia, London, or New York session, depending on the week, rather than at one fixed time.
Is this pattern guaranteed to repeat?
No. This is a backward-looking observation from a limited number of recent weekly ranges, not a predictive model or financial advice. Past repetition of a pattern does not guarantee it continues.
SOURCES & DATA
Education, not financial advice. This is not a trade recommendation. See our editorial process and corrections policy.
TERMS IN THIS STORY
Derek Chu
Bitcoin Almanack's editorial byline for on-chain data, holder behavior, exchange flows, network activity, and technical market structure.
Sources, standards & corrections
Sources are linked inline. Read our editorial information, AI disclosure and corrections policy, or report an error.
Sources are linked inline. Read our editorial information, AI disclosure and corrections policy, or report an error.