
Bitcoin ETF outflows returned on August 28, but the daily reversal is only part of the picture. The dataset used by Bitcoin Almanack’s Bitcoin ETF Flow Tracker records a $201.8 million net withdrawal after nine consecutive positive sessions. Those nine sessions brought in approximately $3.044 billion.
Friday therefore removed about 6.6% of the preceding streak’s net inflow, based on our calculations from the same unrounded daily series. That is meaningful selling pressure through the ETF channel, but it is not evidence that the entire run of demand disappeared.
Where Friday’s Bitcoin ETF outflows came from
ARK 21Shares’ ARKB accounted for the largest withdrawal, followed by Bitwise’s BITB and BlackRock’s IBIT. Morgan Stanley’s MSBT was positive. The table below freezes the August 28 snapshot for this article; the tracker remains the destination for subsequent sessions and source revisions.
| Fund | Net flow |
|---|---|
| ARKB | −$114.9M |
| BITB | −$49.7M |
| IBIT | −$33.4M |
| HODL | −$13.2M |
| MSBT | +$9.3M |
| FBTC | $0.0M |
| Other tracked funds | $0.0M |
| All tracked funds | −$201.8M |
Totals use unrounded inputs, so rounded fund rows may not add precisely to the displayed total. Different providers can also publish slightly different estimates. This article uses the tracker’s series throughout rather than mixing a headline total from one provider with fund figures from another.
Why Fidelity shows zero beside an earlier red bar
The dataset records Fidelity’s FBTC at zero net flow on August 28, following approximately $83.6 million of outflows on August 27. A latest-session card and a seven-session chart are showing different time windows. The earlier red bar can therefore be correct while the latest number reads $0M. An orange bar marks a recorded zero; it is not an outflow.
A recorded zero is not the same field value as missing data. It means the source series records no net flow for that session; it does not mean nobody traded FBTC shares. FINRA distinguishes primary-market creations and redemptions from secondary-market trading, where existing shares change hands. These are provider estimates, not an independent confirmation from Fidelity of every underlying creation or redemption.
The rolling totals still matter
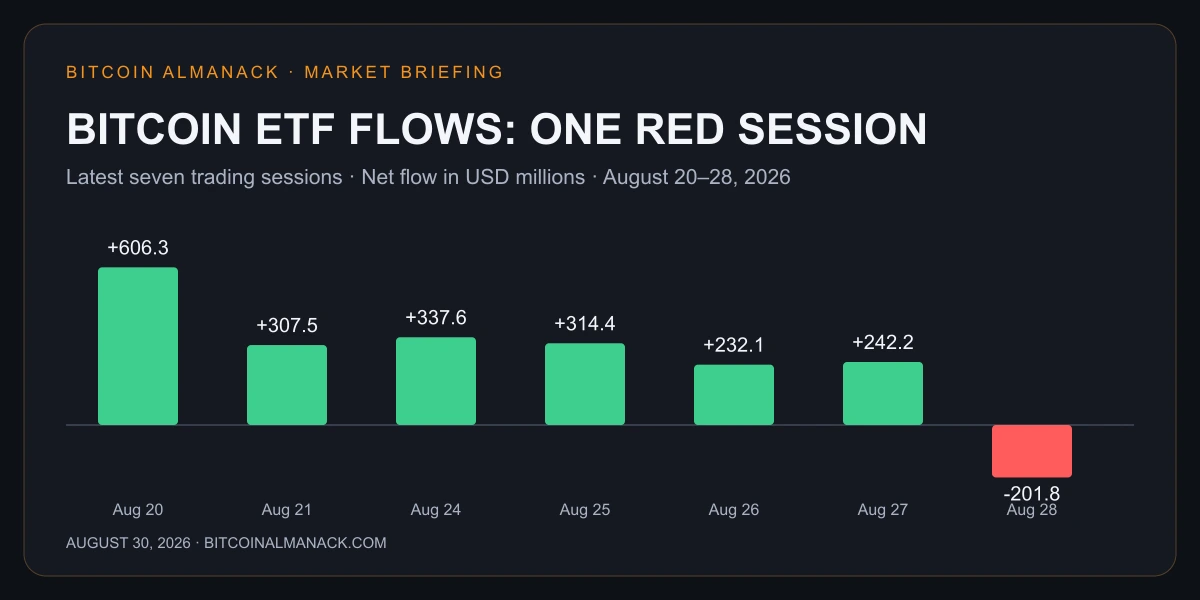
Including Friday, the latest seven trading sessions remained approximately $1.838 billion net positive. The latest 30 sessions were approximately $3.278 billion positive. Both calculations use trading sessions—not seven or 30 calendar days—and end on August 28.
Those totals put the reversal in perspective, but they need careful interpretation. A rolling total can fall because an older large inflow drops out of the window, even when the newest session is positive. Read the new daily observation alongside the changing window rather than treating every decline in the rolling figure as fresh selling.
What the next sessions can—and cannot—tell us
A return to positive flows would show that the ETF channel attracted net capital again. It would not prove that Friday was profit-taking: flow data alone does not identify sellers’ motives. Continued withdrawals across several funds would provide stronger evidence of a broader slowdown than another isolated negative print.
Watch the breadth as well as the total. A large inflow into one fund can offset withdrawals elsewhere, while investors switching products can produce opposing fund-level readings. The same caution applies to calling these figures purely “institutional demand”: spot Bitcoin ETFs are accessible to both institutions and individual investors.
Flows also are not assets under management or exchange trading volume. A fund’s assets can rise because Bitcoin appreciates, without equivalent new net subscriptions. Readers choosing a product should use our Best Bitcoin ETFs in 2026 guide; the IBIT vs. FBTC comparison examines product differences rather than ranking funds by a single day’s flows.
Demand will share the stage with the Fed
The next completed sessions arrive during a week of important U.S. economic releases. Our Bitcoin week-ahead outlook explains the jobs-report risk, while Saylor’s latest Strategy signal adds a separate corporate-demand question. Neither replaces the ETF evidence.
Friday broke a streak. Whether it begins a sustained withdrawal cycle remains an open question. The useful next step is to compare the next dated, completed session—not to treat a weekend with no new U.S. ETF session as another zero-flow trading day.
SOURCES & DATA · AUGUST 30, 2026
Calculations use the August 28 closing session in the Bitcoin Almanack ETF tracker dataset, retrieved August 30 at 03:27 UTC, sourced from ByKaranteli · SoSoValue. Underlying public dataset. Figures are estimates and may be revised. Streak, seven-session and 30-session calculations use unrounded totals; individual fund amounts are rounded for display. This article is a dated analysis, not a live feed or investment advice.

Marisol Vega
Bitcoin Almanack's editorial byline for Bitcoin markets, spot ETF flows, institutional activity, regulation, and daily news.