Three green weeks, seven percent recovered: where ETF flows actually stand
Spot bitcoin ETFs have now posted three consecutive weekly inflows — the first such run since early May. Added together they come to about $307 million, against the $4.5 billion that left in June. The direction changed; the magnitude has not.
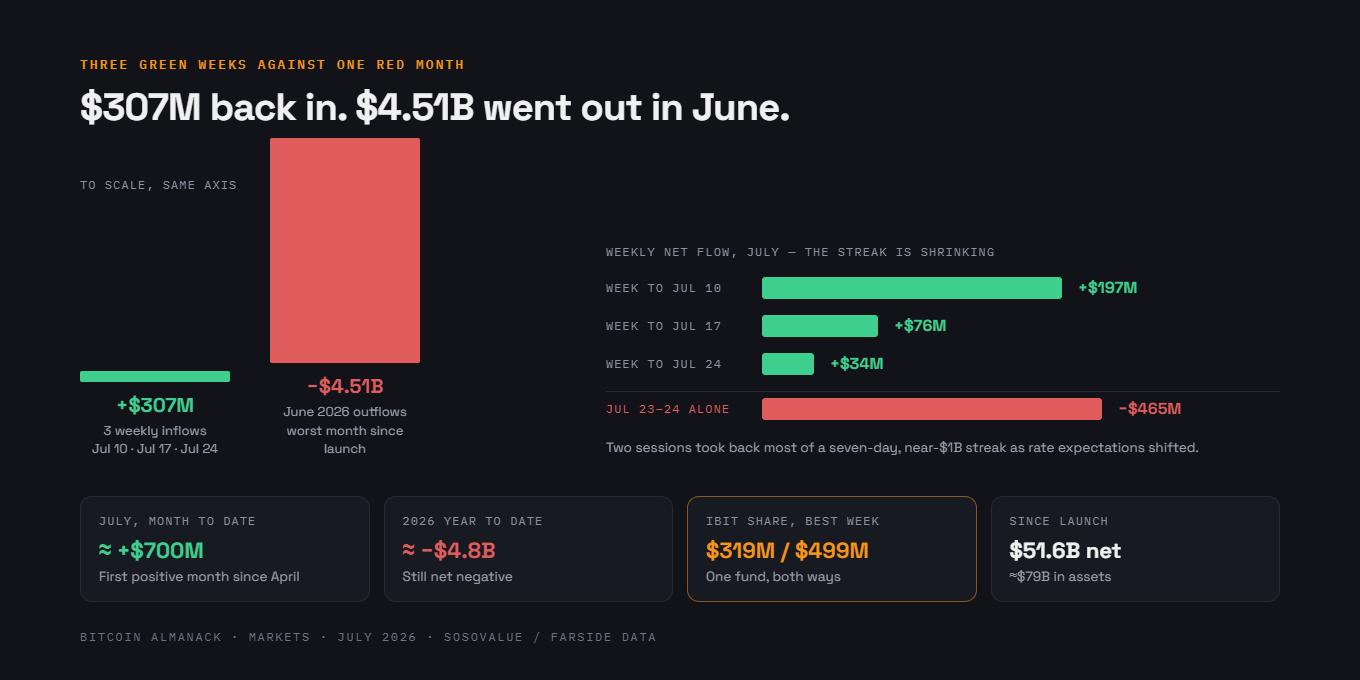
July's three positive weeks against June's outflow, to scale. Chart: Bitcoin Almanack.
UPDATE · {{ updated }}
The new week has opened negative. Spot bitcoin ETFs posted about $11.6 million of net outflows on Monday July 27 — led by IBIT at roughly $8.8 million out — then a near-flat Tuesday, around $1.2 million in. On a rolling seven-day basis the complex is down roughly 3,170 BTC, about $200 million, with IBIT alone accounting for more than the entire category's decline. Ether funds went the other way again, adding about $21 million on Tuesday after leading all spot crypto ETFs the prior week. Assets in the bitcoin funds sit near $76.2 billion. The Federal Reserve's decision lands today, which is the variable that ended the last streak.
The headline is accurate and almost useless on its own: US-listed spot bitcoin ETFs have logged three straight weeks of net inflows, their first three-week run since early May, after eight consecutive weeks of redemptions. The useful version needs the sizes attached. Week ended July 10: about $197 million in. Week ended July 17: about $76 million. Week ended July 24: about $34 million. The streak is real and it is decelerating every week.
Scale it against what it is recovering from. June alone saw roughly $4.51 billion of net outflows — the worst month for these products since they launched in January 2024. Three green weeks totalling roughly $307 million recover about seven percent of that single month. Counting all of July's inflows, roughly $700 million and the first net-positive month since April, you get to about fifteen percent. For 2026 to date the complex remains around $4.8 billion net negative.
Inside that last week is the pattern worth watching. Seven consecutive sessions of inflows pulled in nearly a billion dollars, the strongest stretch in about eleven weeks — then two sessions took roughly $465 million back out, about $225 million on July 23 and $240 million on July 24, as expectations moved toward the Federal Reserve holding or hiking rather than cutting. The week still closed positive, barely. A run that takes seven sessions to build and two to mostly unwind is not a trend; it is a market with thin conviction on both sides.
Concentration is the other thing the complex-wide number hides. In the strongest week, BlackRock's IBIT accounted for about $319 million of $499 million in inflows, leading every session. It then led the reversal, shedding about $212 million on July 24 while Fidelity's FBTC lost about $28 million and several other funds printed nothing at all. Earlier in July, IBIT took in roughly $204 million during a week when the whole complex managed $76 million, because money was leaving FBTC at the same time. When one fund is both the inflow and the outflow, "institutional demand is returning" is doing a lot of work.
Why any of this matters to price: ETF flows are now a structural input, not just a sentiment reading. Creations and redemptions move real spot bitcoin through authorized participants, and research cited through 2026 attributes roughly 45% of weekly price movement to flows. Citigroup's work put each $100 million of net inflow at about 53 basis points of same-day move, compounding toward 96 basis points over ten sessions. At that sensitivity, a $34 million week is noise — which is roughly what price did, drifting from a July high above $66,500 back under $64,000 amid profit-taking and a soft Nasdaq.
The bearish read has institutional backing. On July 1 Citigroup cut its twelve-month ETF inflow forecast from $10 billion to zero and lowered its bitcoin price target from $112,000 to $82,000 — its second downgrade of the year. The counter-argument is duration rather than momentum: since launch these funds have absorbed about $51.6 billion net and hold roughly $79 billion in assets, near six percent of all bitcoin. Eric Balchunas's gold-ETF comparison is the honest frame — spectacular runs, painful drawdowns, recoveries, with each cycle capable of a higher high. That is a decade-scale argument, and it says nothing about August.
The first two sessions of this week make that case sharper rather than weaker: a small outflow Monday, a flat Tuesday, and a rolling seven-day figure back in the red — with ether funds quietly out-drawing bitcoin funds for a fourth week. What would change the picture is breadth, not size. Several issuers taking in money on the same session, with FBTC and the smaller funds positive alongside IBIT, would say allocation rather than one desk rebalancing. Absent that, the reasonable summary is that selling pressure has eased and buying has not really arrived — which is a materially different statement from the one most of this week's headlines made.
BITCOIN ALMANACK ANALYSIS
The three green weeks, in context
PERIOD
NET FLOW
NOTE
Week ended Jul 10
+$197M
Streak begins
Week ended Jul 17
+$76M
IBIT +$204M, FBTC −$181M
Week ended Jul 24
+$34M
Smallest of the three
Jul 23–24 alone
−$465M
Fed repricing
July, month to date
≈+$700M
First positive month since April
June 2026
−$4.51B
Worst month since launch
Mon Jul 27
−$11.6M
New week opens red, IBIT −$8.8M
Tue Jul 28
+$1.2M
Effectively flat
Rolling 7 days
≈−$200M
−3,170 BTC; IBIT −3,511 BTC
2026 year to date
≈−$4.8B
Still net negative
Weekly figures per SoSoValue and Farside as reported; totals rounded · Table: Bitcoin Almanack
WHY IT MATTERS
"Third straight week of inflows" and "seven percent of June recovered" describe the same data and imply opposite things. If you hold bitcoin because of a monetary thesis, neither number should change your behaviour — but if you are reading flows as a demand signal, the number that matters is breadth across issuers, and that has not turned yet.
What to watch next
1.Breadth, not totals. A session where four or more issuers are positive together says allocation. Another IBIT-only week says one desk.
2.The Fed's next move. Two sessions of rate repricing erased most of a seven-day streak. Rate expectations are currently the dominant variable in these flows, ahead of anything crypto-specific.
3.Whether a fourth green week holds above $100M. The trend is positive but shrinking each week. A fourth week smaller than the third would be a fading streak, not a recovery.
4.Citi's zero. A twelve-month inflow forecast of exactly zero is a testable call. Track the running total against it rather than re-litigating the target price.
Frequently asked questions
How much have bitcoin ETFs taken in this month?
About $700 million across July — the first net-positive month since April. Against June's roughly $4.51 billion of outflows that recovers about 15% of one month, and 2026 remains around $4.8 billion net negative.
Do ETF flows move the bitcoin price?
They are one of the larger inputs — research through 2026 attributes roughly 45% of weekly price movement to flows, and Citigroup put each $100 million of net inflow near 53 basis points of same-day move. That is a correlation, not a lever.
Why does IBIT's dominance matter?
Because it turns a market-wide story into a single-fund one. IBIT was $319 million of $499 million in the best week and led the $212 million outflow day that followed. Breadth across issuers is the better read on institutional demand — see our ETF rankings.
What ended the seven-day inflow streak?
Roughly $465 million of outflows across July 23 and 24 as rate expectations shifted toward the Fed holding or hiking. The week still finished positive at about $33.8 million.
SOURCES & DATA
CoinDesk — third straight weekly inflow, $33.79M week ended July 24 ↗
Crypto Times — per-fund detail on the July 24 outflows (Farside data) ↗
24/7 Wall St. — IBIT's share of the seven-session streak, July MTD and YTD totals ↗
GNcrypto — Citigroup's revised forecast and the muted-recovery read ↗
BeInCrypto — July 28 daily and rolling seven-day netflow, IBIT detail ↗
Coin Gabbar — July 27 per-fund flows (SoSoValue data) ↗
Flow figures come from third-party trackers (SoSoValue, Farside) and are revised; treat them as approximations rather than audited numbers. Percentages are ours. Not investment advice — see our editorial process and corrections policy.

Marisol Vega
Markets & ETFs Reporter. Follows the flow ledger, the funds behind it, and the policy that shapes both.