Bitcoin Almanac on TradingView: a cycle model that never repaints, because it never looks
WillyAlgoTrader's free overlay puts cycle dates, hyperbolic curves, Fibonacci grids and halving markers on one chart — and is unusually honest about its own assumptions. The question is whether the assumption still holds.
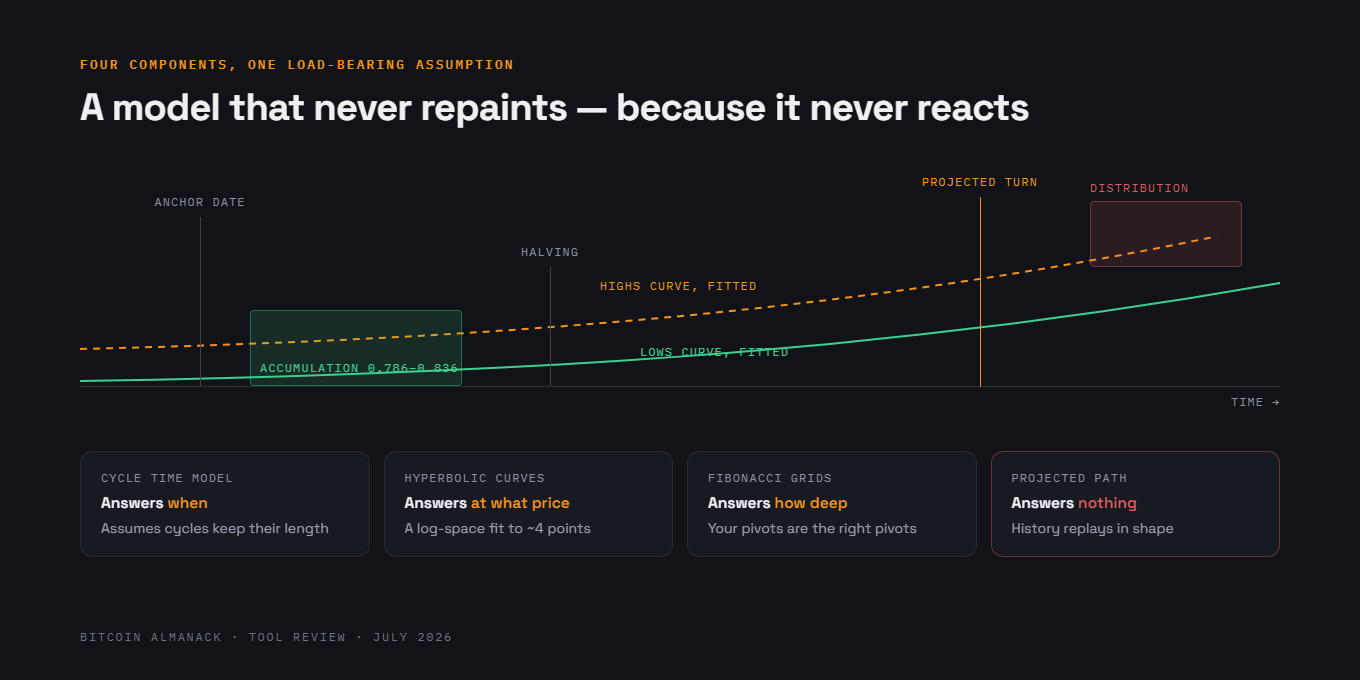
How the model's four components chain together, and what each one assumes. Schematic: Bitcoin Almanack, not a TradingView screenshot.
OUR SCORE
7.2/10
Excellent as a framework you argue with. Dangerous if you read the projected path as a forecast.
THE TOOL
Bitcoin Almanac v1.5.2 · WillyAlgoTrader
TradingView · Pine Script, open-source
Free · built for BTC daily & weekly
There are thousands of Bitcoin indicators on TradingView and most of them are a moving average wearing a costume. Bitcoin Almanac is a different animal: an overlay that tries to draw the entire macro landscape at once — a fixed-length cycle model projected from a single anchor date, two hyperbolic curves fitted through historical cycle lows and cycle highs in log-price space, Fibonacci grids stretched between macro pivots, halving markers, accumulation and distribution zones, and a hypothetical path for the next bull leg, all summarised in a dashboard of projected turn dates and curve prices.
The design logic behind stacking those pieces is the best thing about it. A cycle-date model tells you when but not at what price. A curve through prior lows tells you where support has migrated but not when price will get there. Fibonacci retracements suggest where pullbacks end, but only once you know which leg to anchor them to. The script chains them: anchor date to projected turn dates, turn dates to curve prices at those dates, macro pivots to Fibonacci grids, and the 0.786–0.836 band to an accumulation zone bounded by cycle end dates. Each component supplies the dimension the others are missing.
It also does something rare in this corner of the internet: it states its limits in its own description. No intraday entries, no stops, no position sizing, the projected path explicitly hypothetical, a dashboard warning if you load it on an intraday timeframe. The code is open-source, so the assumptions are readable rather than implied. After a decade of black-box "algo" scripts sold on Telegram, that alone earns goodwill.
Now the part that matters. The author notes that nothing repaints, which is true — everything is driven by dates and user-defined pivots rather than by live price. But it is worth being precise about why that is true. The chart does not repaint because it never reacts. Feed it a cycle that runs six months long or two years late and the lines will not move; they will simply be wrong with the same confident geometry. A reactive indicator that repaints at least tells you it has changed its mind.
That makes cycle length the load-bearing assumption, and cycle length is exactly what changed. Spot ETF flows, corporate treasuries and a real options market have all arrived since the pattern being extrapolated was formed — three demand sources that did not exist when the earlier cycles set their rhythm. A four-year clock anchored to the halving schedule is a reasonable prior, not a law, and hyperbolic curves fitted to three or four observations are a stylised fit rather than a statistically robust one. The correct use is to treat projected dates as a hypothesis you actively try to invalidate.
Used that way it is genuinely useful. The accumulation and distribution zones give you a place to pre-commit a plan before emotion arrives, which is the same argument we make for dollar-cost averaging. The historical correction depths in the dashboard are a healthy reminder of what normal drawdowns look like — worth rereading whenever a 30% pullback feels terminal. And because pivots are user-set, you can drag the model onto your own read of where this cycle's low sat and see whether the resulting geometry looks sane or absurd. That is a much better exercise than accepting the defaults.
What it will not do is tell you what to do at $63,700 on a Tuesday. Structure, not signal — pair it with something that actually reads price, whether that is the weekly open, support and resistance, or on-chain cost-basis work. And keep the projected path collapsed unless you are actively stress-testing scenarios; a drawn line on a chart is a remarkably effective way to talk yourself into a target.
BITCOIN ALMANACK ANALYSIS
Four components, four assumptions
COMPONENT
WHAT IT ANSWERS
WHAT IT ASSUMES
Cycle time model
When phases turn
Cycles keep their length
Hyperbolic curves
Where highs and lows migrate
A log-space fit to ~4 points holds
Fibonacci grids
Where pullbacks may end
Your pivots are the right pivots
Accumulation zones
Where to pre-plan buys
Depth repeats, roughly
Projected bull path
A scenario to argue with
History replays in shape
Our reading of the model's stated design · Table: Bitcoin Almanack
WHY IT MATTERS
Cycle-model charts are the most screenshotted objects in bitcoin and the least examined. This one is open-source and explicit about being hypothetical, which makes it a good teaching tool for the thing most retail traders get wrong: precision is not accuracy. A line drawn to the day is not evidence that the date is knowable.
How to use it without fooling yourself
1.Set your own pivots. The defaults encode someone else's read of where cycles began and ended. Enter yours, and notice how much the projection moves — that sensitivity is the honest measure of the model's confidence.
2.Write down what would invalidate it. A date passes without a turn; price closes months below the lows curve. Decide now what would make you abandon the framework, before you are emotionally invested in it.
3.Use the zones, not the path. Accumulation and distribution bands are useful as pre-commitment devices. The projected bull leg is a drawing, and should be turned off most of the time.
4.Keep it on daily or weekly. The dashboard warns you on intraday timeframes for a reason: there is no intraday information in a date model.
Frequently asked questions
Is the Bitcoin Almanac indicator free?
Yes. It is published as an open-source Pine Script on TradingView, free to add to a chart, and the code can be read and verified by anyone.
Does it repaint?
No — every element is driven by dates and user-defined pivots rather than live price, so today's lines are yesterday's lines. The trade-off is that the model does not update when price disagrees with it.
Can you trade signals from it?
Not directly. The author is explicit that it produces no intraday entries, no stop placement and no position sizing, and that the projected path is hypothetical. It is scenario visualisation, not a strategy.
What is the main weakness of a fixed-length cycle model?
It assumes the next cycle runs about as long as the last ones. With ETF flows, corporate treasuries and options markets now shaping demand, cycle length is the least stable part of the framework — treat projected turn dates as a hypothesis, not a schedule. Our dominance and on-chain work is a useful cross-check.
SOURCES & DATA
TradingView — Bitcoin Almanac [WillyAlgoTrader], script page and description ↗
TradingView — Bitcoin indicator directory, for comparison ↗
Reviewed on a free TradingView account against BTCUSD daily and weekly charts. We have no relationship with the script's author and received nothing for this review. Nothing here is financial advice — see how we review and our terms.

Derek Chu
On-chain & Technical Analysis. Spends his time separating patterns that repeat from patterns that merely rhyme.